
Maps

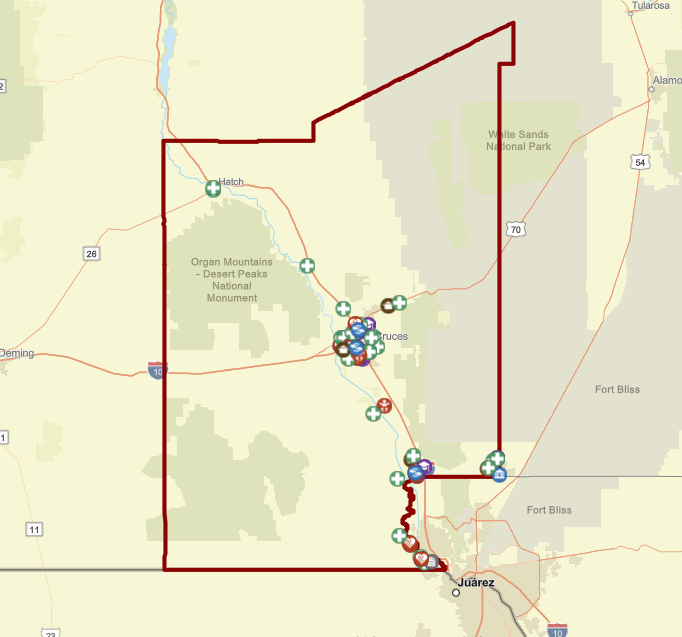
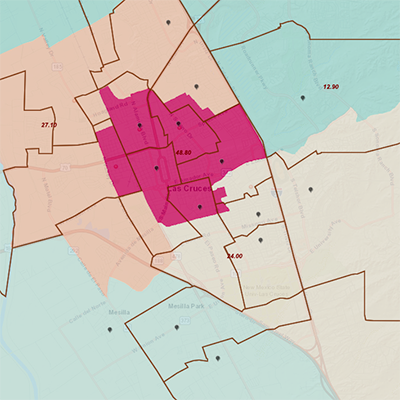
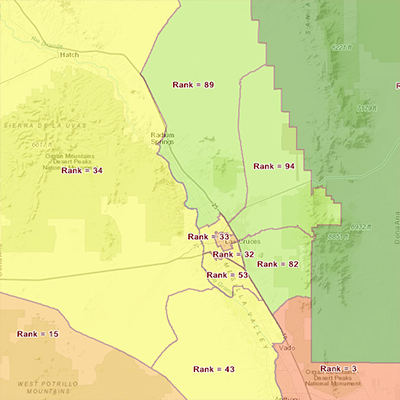
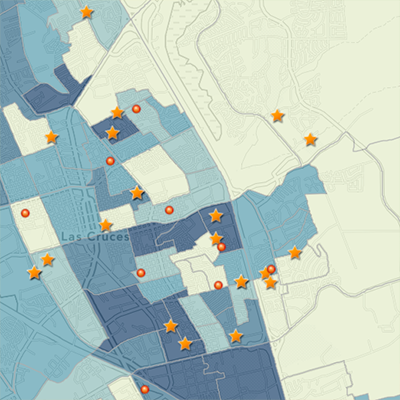
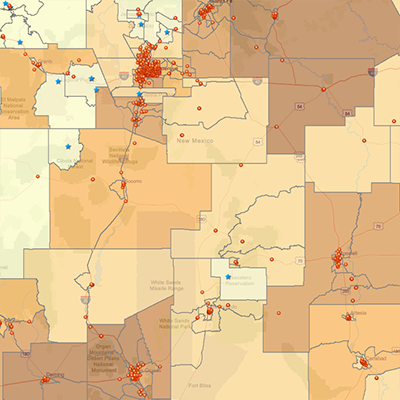
Our interactive maps visualize the geographic distribution of socioeconomic indicators across New Mexico.

The majority of these maps are the result of six years of work by the New Mexico Community Data Collaborative and numerous partners advocating for improved outcomes for young children.

Map showing supportive services for immigrant families in Doña Ana County

Immigrant Inclusivity in Doña Ana County, New Mexico

A study mapping supportive services, such as medical, mental health, early childhood, and social services, accessible to immigrant families.

Web Map by Center on Immigration and Child Welfare (CICW) | New Mexico State University

Last Modified: February 19, 2023

Map showing socioeconomic and health factors within LCPS school attendance zones

LCPS Boundaries, Poverty, Vulnerability, Housing, 2019

What socioeconomic and health factors exist within the school attendance zones of Las Cruces Public Schools? – Poverty, Rates of Child Abuse, Drug Overdoses, Internet, Housing, and more within LCPS School boundaries.

Web Map by NMCDC, Erica Surova | Last Modified: June 3, 2021

Risk assessment map showing early childhood health development indicators across New Mexico

Risk Assessment for Early Childhood Health Development, 2016

The risk assessment map contains 12 key indicators and 2 composite indices that measure community risk factors associated with early childhood health and development in each of New Mexico's 108 Small Areas. The 12 indicators were selected by more than a dozen early childhood advocacy organizations and agencies. This was a collaborative process to identify the most important measures for early child risk and to create an index that illustrates the combined impact on sub-county communities.

Web Map by NMCDC, Harvey Licht | Last Modified: August 28, 2017

Map showing licensed child care centers by Star Quality rating in Doña Ana County

Early Childhood Education in Doña Ana County

This map illustrates the location of licensed child care centers by Star Quality rating in relation to families living in poverty. Other education and health related variables can be added to the map.

Web Map by NMCDC, Tom Scharmen and Erica Surova | Last Modified: September 26, 2017

Map showing New Mexico school indicators including enrollment, poverty, and graduation rates

New Mexico School Indicators, 2016

Schools by level, grade enrollment, poverty, graduation rates, and 3rd grade reading proficiency.

Web Map by NMCDC, Larry Heard | Last Modified: July 28, 2017